ACKNOWLEDGEMENTS
We would like to thank the following individuals and partners who provided their time, efforts, and feedback to make LADOT’s inaugural Walk & Bike Count a success.
PREPARED BY
Jaclyn Garcia, Walk & Bike Count Coordinator
Michael Consunji, Student Professional Worker
Lala Mehrabian, Graphics Designer
PARTNERS
Los Angeles County Bicycle Coalition (LACBC)
Los Angeles Walks
UCLA Institute of Transportation Studies (UCLA ITS)
Southern California Association of Governments (SCAG)
For the last decade, LACBC and LA Walks have been the primary organizers of regularized bicycle and pedestrian counts throughout the city, tapping into a network of hundreds of volunteers. Thank you for your leadership, guidance, and accountability to continue the mission of improving transportation for everyone.
VOLUNTEERS
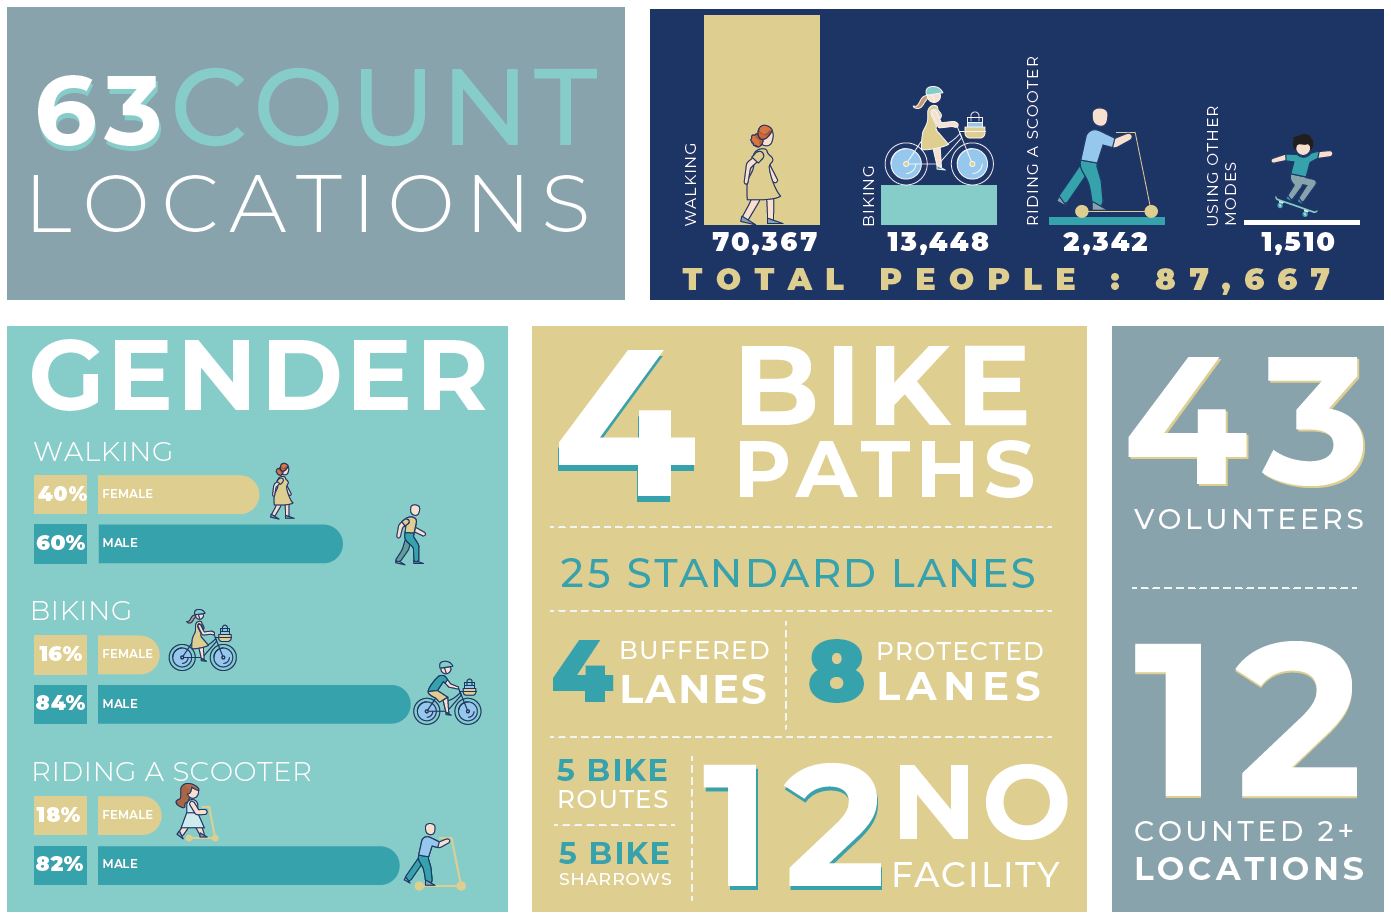
We would like to give a special thanks to the 43 volunteers who contributed their time to our count. In addition to dedicating two hours of their time on a weekend, many volunteers also attended our in-person training session. Half of our volunteers were seasoned counters, and 12 people volunteered for two or more locations. We couldn’t have done it without your help!
Despite Los Angeles’ characterization as a car capital, throughout our history, residents and visitors have navigated the city by all modes of travel, including on foot, by bike, and even by horse. Over the last decade, Los Angeles has seen unprecedented investments in transportation infrastructure through new funding streams and initiatives, including our commitment to ending all traffic fatalities by 2025. We have witnessed the emergence of new ways people get around, such as by motorized scooters and bike share systems. Through these investments, the Los Angeles Department of Transportation (LADOT) is continually looking to better understand all the ways that people use our streets and sidewalks.
In 2019 LADOT coordinated its first comprehensive count of people walking and biking on Los Angeles streets. Through the help of city staff, contractors, and citizen volunteers, the Walk & Bike Count captured travel at 63 locations throughout the city. LADOT was set to capture travel at 40 additional locations in spring 2020, but due to irregular travel patterns and safety concerns as the result of the COVID-19 pandemic, this count was postponed indefinitely.
Though we call this a Walk & Bike Count, it collects valuable information on all the ways in which people actively travel. For decades LADOT has collected this same data to inform projects and decision
making. However, there is value added when counts are performed at consistent locations across regular time intervals. For the last decade, the Los Angeles County Bicycle Coalition (LACBC) and LA Walks have been the primary organizers of regularized bicycle and pedestrian counts throughout the city, tapping into a network of hundreds of volunteers. This massive undertaking was no small task with a city as large as Los Angeles, and we thank them and will continue to build off of these efforts in order to develop a robust and comprehensive count program.
The results of LADOT’s first Walk & Bike Count are presented in this report. This initiative is just one of the ways that Los Angeles is measuring its progress towards achieving our strategic and climate goals. The information we collected will be used to inform decision making on how transportation funding is used and how to make streets that feel safe and comfortable for all ages and abilities.
As our count program develops, we hope to add more count locations that will help us better understand trends across the city. Thank you to all that made this count a success. The data summarized in this report will be made publicly available for your use. Visit http://ladot.lacity.org to learn more.


WHAT’S MEASURED MATTERS
The Walk & Bike Count seeks to understand the current trends in active transportation and to better understand the characteristics of those traveling on Los Angeles streets. The data collected from the count serves several important purposes such as:
• Tracking changes in people using active modes of transportation;
• Providing data to inform and support decision making;
• Tracking usage before and after transportation projects and pro-grams are implemented;
• Understanding how travel trends and behaviors vary across geo-graphic areas and street typologies;
• Forecasting and projecting future usage on projects being planned and designed;
• Evaluating the impact of differing design treatments on crash rates; and
• Identifying locations for future bicycle and pedestrian improvements
This report will include an overview of the 2019 count, and will also summarize trends over time through comparing to counts previously collected in the LACBC and LA Walks Bike + Ped Count. 41 of our count locations have historic data, with some dating back to 2009.
WHERE DID WE COUNT?
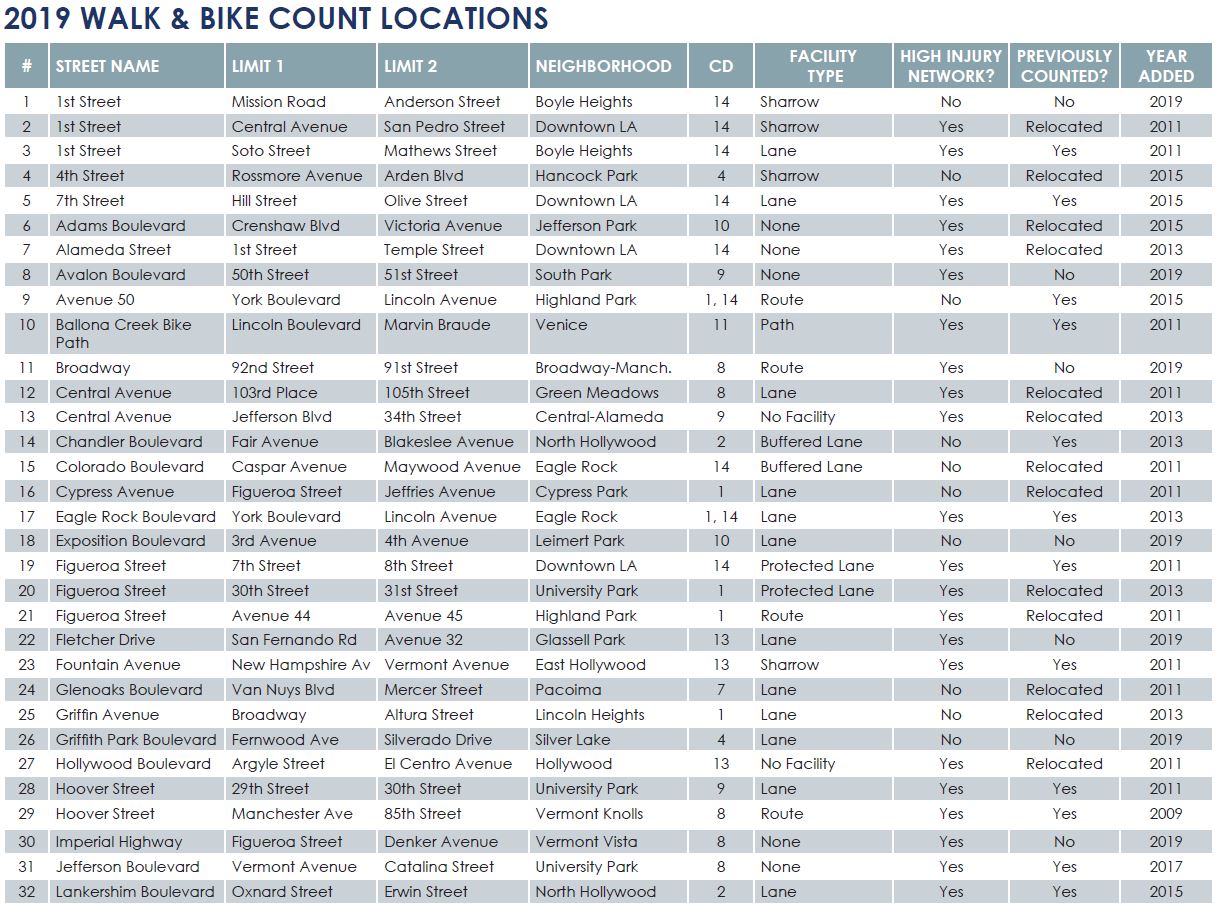
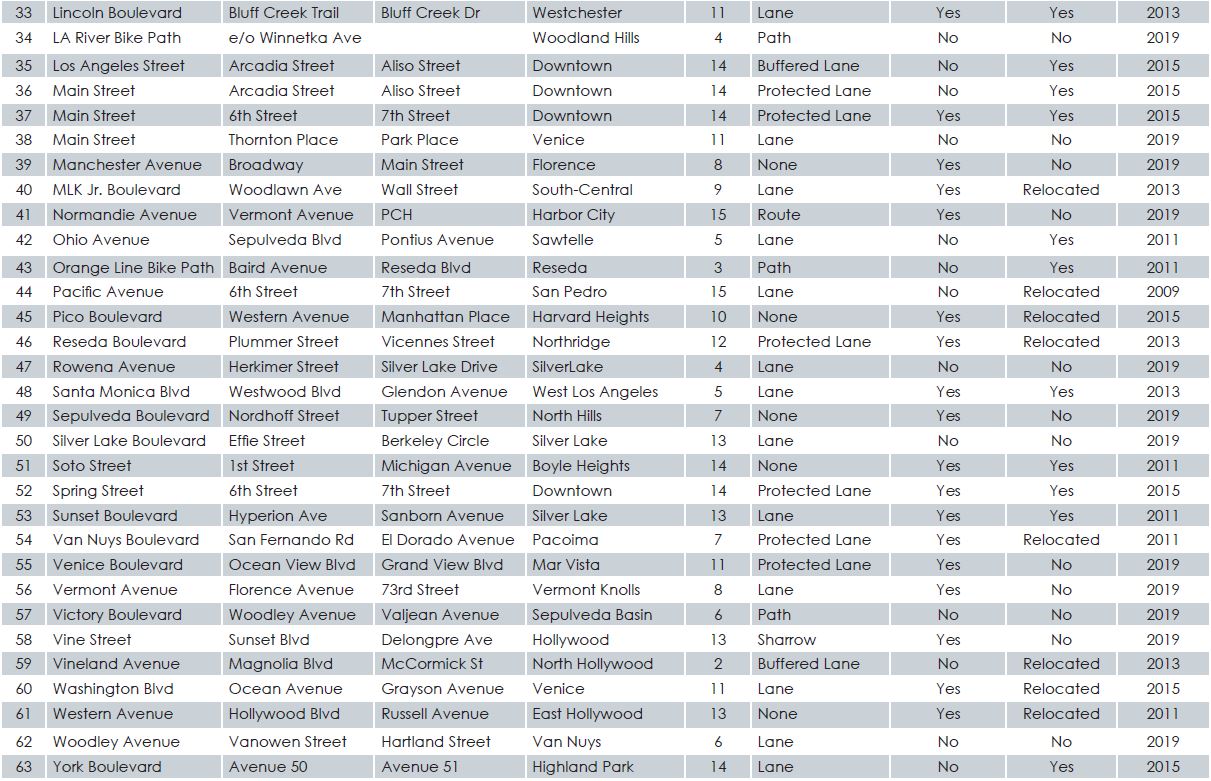
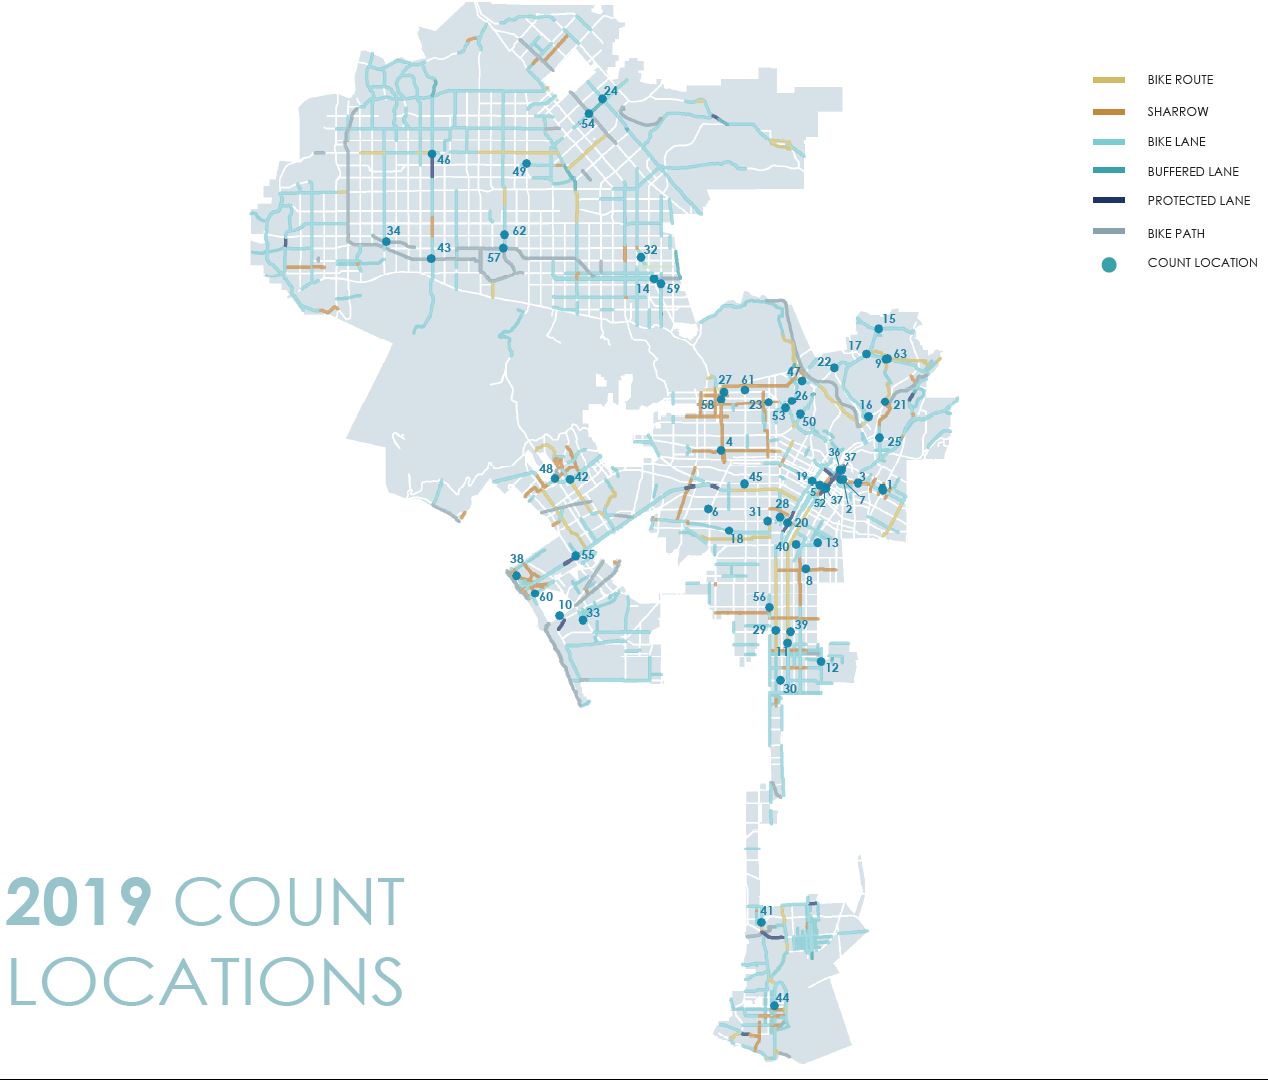
Our inaugural count in fall 2019 includes a set of 63 locations that span across all areas of the city and all bicycle facility types. This count was to be supplemented by 40 additional locations in spring 2020. Due to city and statewide Stay at Home Orders that took place through spring during the COVID-19 pandemic, the count was postponed indefinitely.
There is existing guidance for the selection of pedestrian and bicycle count locations. The National Bicycle and Pedestrian Documentation project, a leading resource for pedestrian and bicycle count programs, recommends focusing on targeted locations where activity levels and program interest are the highest and recommend count locations that include:
• High walking and biking activity corridors;
• Multi-use paths and parks;
• On-street bikeways, especially at locations with few alternative parallel routes;
• Downtown areas, especially locations near transit stops;
• Employment areas, especially near main access roads;
• Locations representing urban, suburban, and rural contexts;
• Key corridors that can gauge impacts of future improvement projects;
• Locations with existing and ongoing historical counts; and
• Locations with high pedestrian and bicycle collision rates
While this guidance is especially useful for establishing new count programs, Los Angeles already has a decade of count data from as many 140 locations from the community-organized Bike + Ped Count. We have kept many of these locations for consistency, keeping those that best matched the criteria outlined above. The Walk & Bike Count also includes over 22 new locations that meet one or more of these criteria. These locations include Vision Zero priority corridors, locations with recent or future pedestrian and bicycle facility improvements, and locations that expand the geographic diversity of our count.
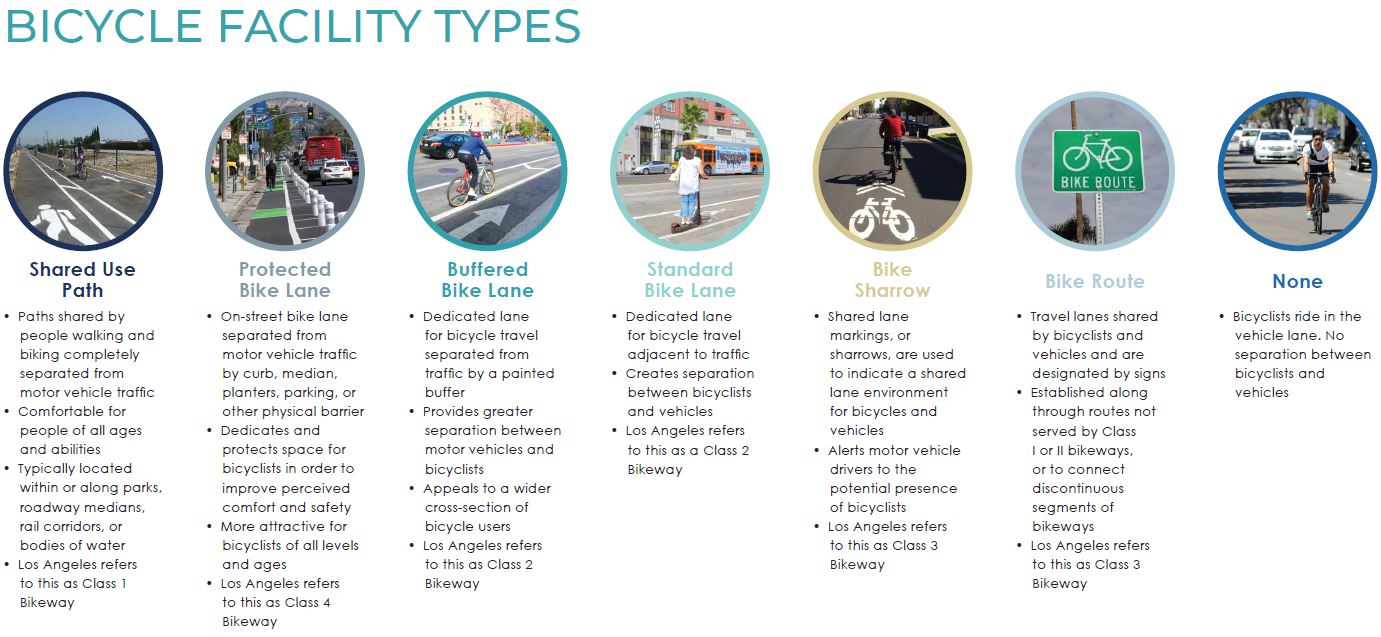
To understand ridership patterns and behavior, we established count locations in various bicycle facility types. It is important that we continue to count at locations where bicycle facilities have been added or improved, which will allow us to assess how these improvements have changed user behavior.
Our locations include the following facility types:
HOW WAS DATA CAPTURED?
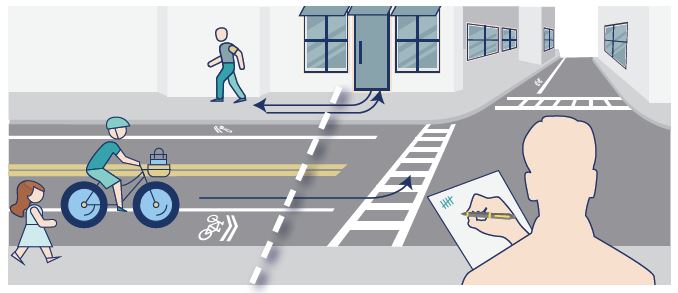
The Walk & Bike Count captures people traveling along a block rather than traveling through an intersection. This method, known as a screen-line count, establishes an invisible line across a block and counts the number of people who pass over that line, noting their direction of travel. Below illustrates how a screenline count is performed.
LADOT used a combination of in-field observations through volunteers and observations made through video cameras. Video observations require staff to temporarily set up and remove a video camera at the count location, which allows staff to observe the footage in the office. The accuracy of counts through video is increased due to the ability to rewind/re-review footage as needed.
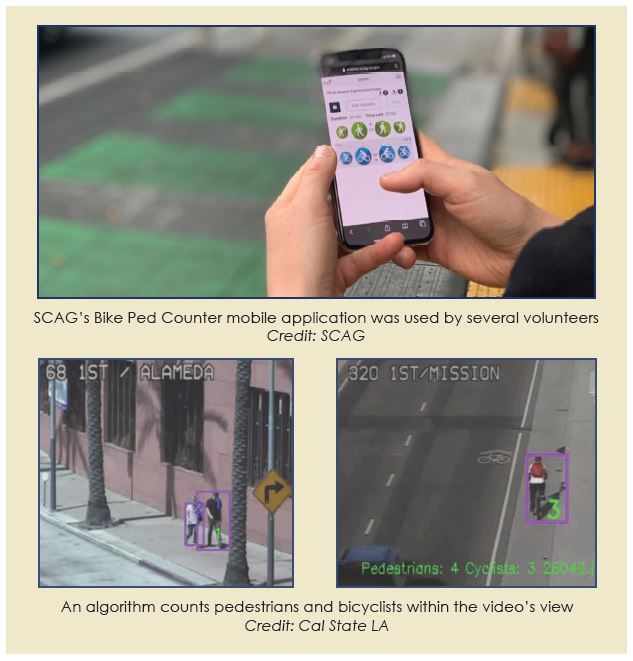
43 volunteers provided support with capturing weekend travel. Volunteers were invited to attend an optional in-person training session prior to their shift, and training material was provided by email for those that did not attend. The training went over how to perform counts using count forms or a mobile app, what to bring to the count site, and how to classify unique travelers. The 2019 count provided volunteers with an opportunity to test out the Southern California Association of Governments (SCAG) newly developed mobile phone counting application, which could be used instead of traditional paper count forms.
A small number of count locations had the opportunity to pilot new counting technology through a $825,000 grant awarded by the Toyota Mobility Foundation to LADOT, the City of Los Angeles Information Technology Agency, and California State University Los Angeles. This grant funded the development of a machine learning algorithm that was developed to detect people walking and biking using video collected from LADOT’s permanent cameras located at some intersections. While the software is still being developed and tested, this provided an opportunity for feedback and refinement so that this algorithm can better assist future counting efforts.
WHEN DID WE COUNT?
The Walk & Bike Count aligns with the industry recommendations for col-lecting data on active transportation. All counts were performed be-tween late September and early November, when the sun is out later in the day and weather is more favorable. Counts were performed during the academic school year when more students are walking or biking to school. Holidays, big events, and unusual weather conditions were avoided to eliminate skewing from abnormal travel patterns.
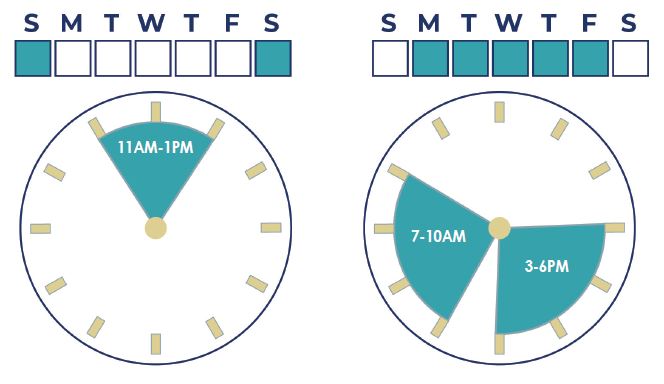
The count captures information during the times of the day with the most activity, the weekday mornings and evenings, and mid-day period on weekends. Weekday counts were performed on a Tuesday, Wednesday, or Thursday, which best represents normal weekday travel patterns. Weekend counts were performed on either Saturday or Sun-day, as research indicates both days have similar travel patterns. Three locations on bike paths (Los Angeles River Bike Path, Ballona Creek Bike Path, Victory Blvd Bike Path) were only counted on a weekend, as this was believed to be the days of the week with the most activity.
WHAT DID WE COUNT?
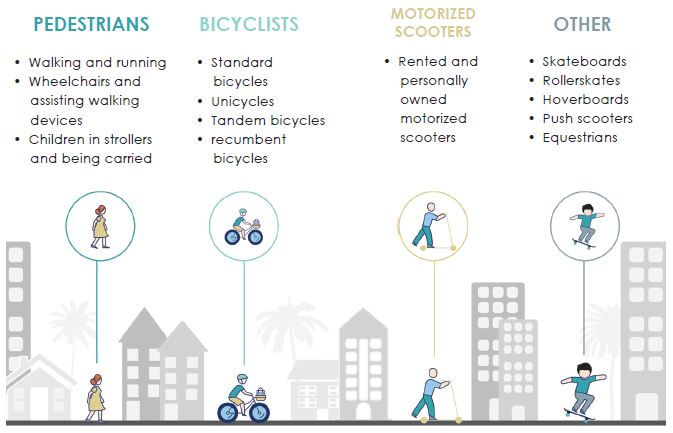
The Walk & Bike Count separates three primary modes of active travel – people walking, biking, and riding motorized scooters. The separation of motorized scooters is necessary as this new mode of transportation has proliferated since dockless rental scooters arrived on city streets in 2017. In 2019 there were as many as 36,000 scooters operating in Los Angeles through as many as eight different companies. In addition, a fourth cat-egory, ‘other,’ groups all other active travel modes. Below describes the way we defined these four categories:
We also collected additional information about each traveler to bet-ter understand the characteristics and behavior of people using each street. The traveler attributes in our count include:
• Pedestrians: perceived gender, use of mobility assistance device, use of stroller
• Bicyclists/motorized scooters/other: Perceived gender, use of hel-met, sidewalk riding, contraflow riding
U.S. AMERICAN COMMUNITY SURVEY
Our report also summarizes annual survey data compiled by the U.S. Census Bureau’s American Community Survey (ACS). While counts provide ground truth on travel at a particular location at a given time, the ACS surveys help us understand citywide trends for commuting travel. The ACS is a nationwide survey that provides communities with reliable and timely social, econom-ic, housing, and demographic data. Each year, the U.S. Cen-sus Bureau mails the American Community Survey (ACS) to a representative sample of households. The survey asks respond-ents how they usually traveled to work the week prior. There are some limitations in this dataset, such as:
• It does not capture non-commute trips, so we do not know how these same people travel for household trips outside of work.
• Respondents are required to choose only one mode of travel for their commute, even if their commute involves multiple modes of transportation.
• The survey only asks respondents about their trips taken in the last week, but reports this as their year-round travel behavior.
We will report on the ACS one-year estimates between 2009 and 2018, the latest available date. 2019 estimates have not been released at the time of this report.

This section summarizes the results of our 2019 count. For pedestrians, we will report on their perceived gender, use of mobility assistance devices, and use of strollers. For bicyclists, motorized scooter riders, and those using other modes, this section will summarize their perceived genders, helmet usage, positioning, and if the user is riding counter to the flow of traffic. All count locations will be referred to by the name of their primary street (ex: Exposition Blvd). When two or more count locations exist on the same street, the cross streets will be included (ex: Figueroa St between 7th St and 8th St).
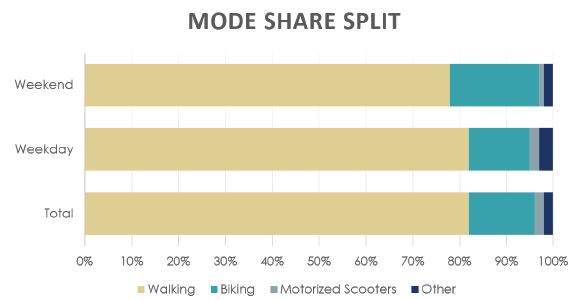
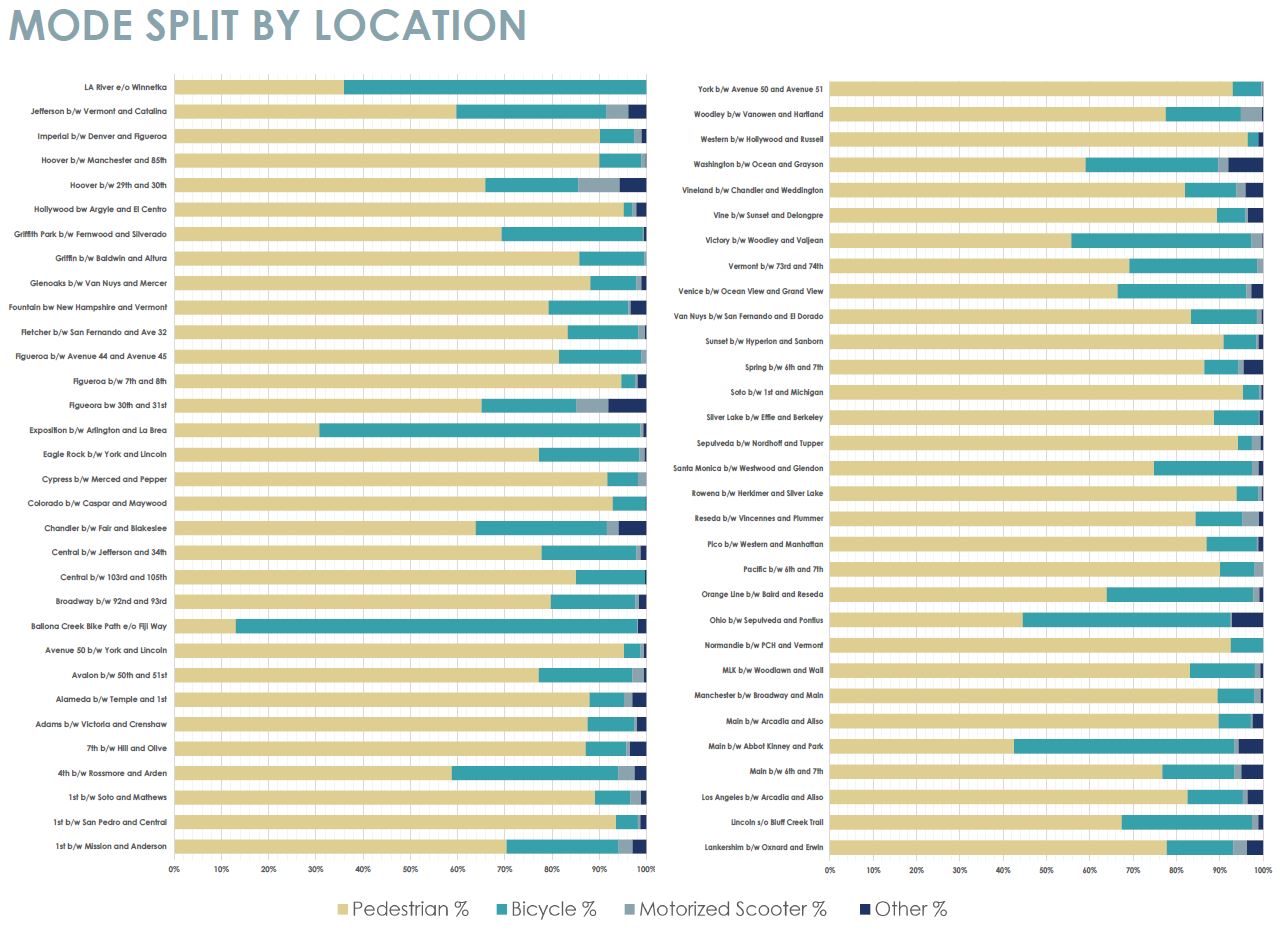
MODE SPLIT
For 2019, the citywide average mode share split was 82% walking, 14% biking, 2% motorized scooters, and 2% using other modes. On weekends, the mode split decreases to 78% walking and increases to 19% biking, with motor scooters at 1% of travel and other modes at 2%. This citywide average mode share split was found to be generally consistent across all facility bike facility types, with the exception of bike paths. On bike paths, the mode share split is 28% walking, 70% biking, nearly 1.5% riding motorized scooters, and less than 1% using other modes.
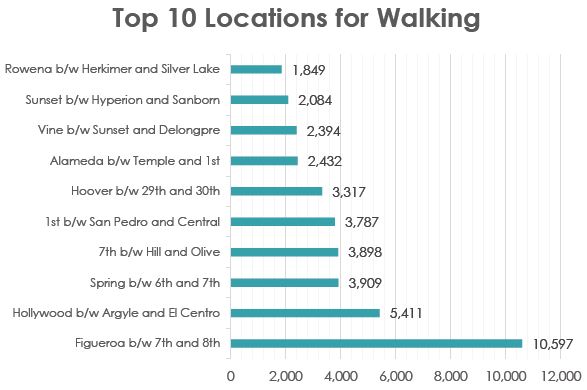
WALKING
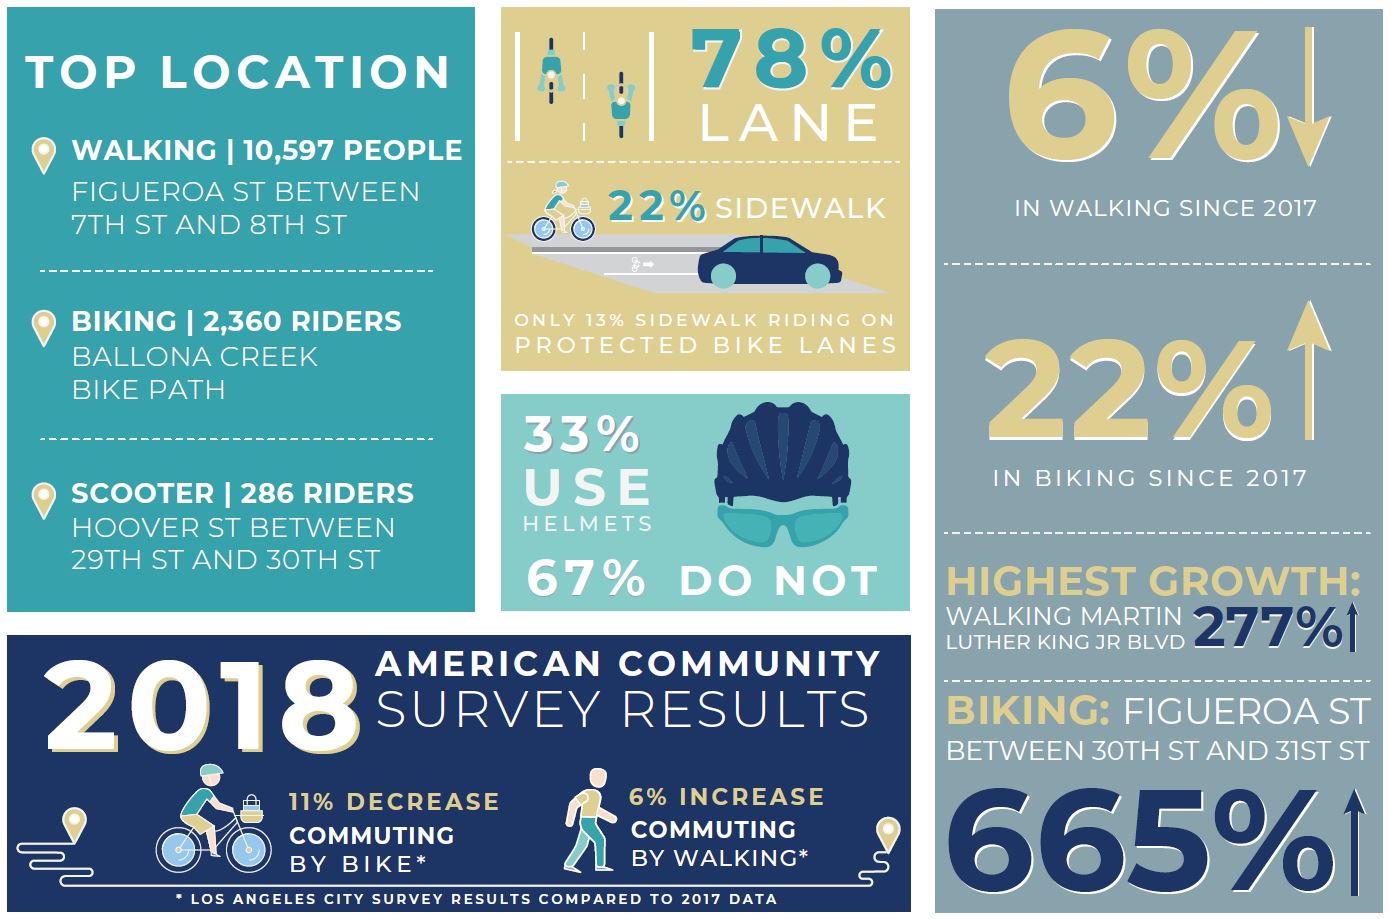
We counted a total of 70,367 people walking during our 2019 Walk & Bike Count. In total volume, the top location for walking was Figueroa St between 7th St and 8th St at 10,597 people. This is nearly double the next highest location, Hollywood Boulevard, at 5,411 people.
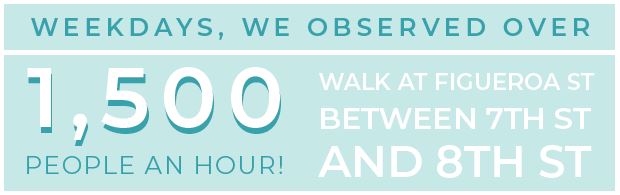
52,383 people were observed walking during our weekday six-hour counts. Not surprisingly, the top locations for walking were along dense commercial corridors. Figueroa St between 7th St and 8th St observed 9,077 people walking during the week, or over 1,500 people an hour. This was followed by Hollywood Blvd at 3,343, and Spring St at 2,593. The locations that captured the lowest number of people walking were Ex-position Blvd at 43 people, Orange Line Bike Path at 88, and Broadway at 103.
17,984 people were observed walking during our weekend counts. Many of the same locations continued to rank the highest, with Holly-wood Blvd counting 2,068 people, or over 1,000 people an hour. 7th St captured 1,836 people, and Figueroa St between 7th St and 8th St captured 1,520. The locations that captured the lowest number of people walking were Exposition Blvd at 5 people, the LA River Bike Path (in West Valley) at 18, and Normandie Ave at 22
STROLLERS
Similar to other count programs, children in strollers are captured as pedestrians in the Walk & Bike Count. We also went one step further and captured all the instances of people using strollers. This data is seldom recorded by agencies, and could assist in prioritizing areas that are in need of further walkability improvements to make traveling with children safer and more accessible.
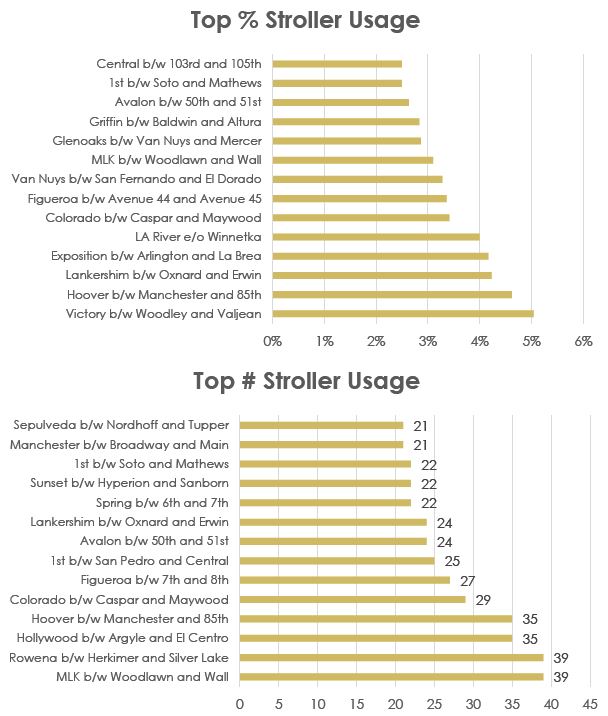
The count observed a total of 774 people using strollers, which averages to just below 1% of all people walking. Stroller usage increased close to 3% on weekends. The highest proportion of people using strollers was at both Victory Blvd and at Hoover St between Manchester Ave and 85th St (5%). Five locations did not observe any stroller users.
Though not unusual, comparing the locations with the top percentages of stroller users yields different results than looking at total stroll-er usage alone. When observing the total numbers, Martin Luther King Jr Blvd and Rowena Ave both reported the highest numbers at 39, fol-lowed by Hollywood Blvd and Hoover (between Manchester Ave and 85th St) at 35.

MOBILITY ASSISTANCE DEVICES
For each person walking, we also noted if they were using an assistive walking device, such as a wheelchair, cane, or walker. This information helps us assess streets that could better support people of all ages and physical abilities.
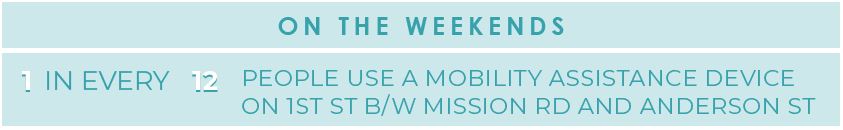
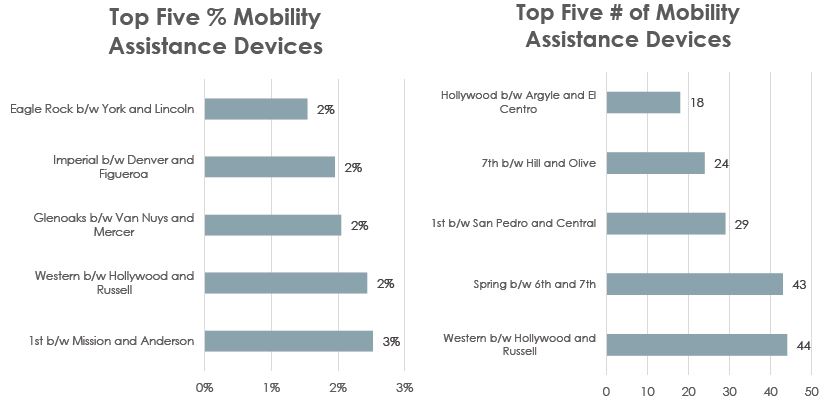
We observed a total of 400 people using a mobility assistance device, an average of less than 1% of the total people walking. This was found to be consistent during both weekends and weekdays. The highest proportion of people using mobility assistance devices was at 1st St between Mission Rd and Anderson St (3%), followed by Western Ave and Glenoaks Blvd (2%). 13 locations did not observe any people using mobility assistance devices. When observing the total numbers, Western Ave ranks the highest at 44, followed by Spring St at 43, and 1st St between San Pedro St and Central Ave at 29.
BIKING
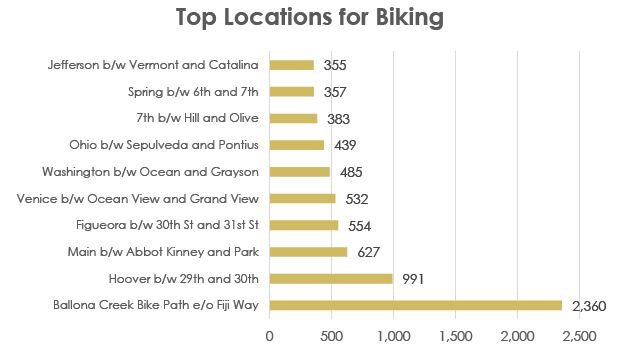
We counted a total of 13,448 people biking in our 2019 Walk & Bike Count. In total volume, the top location for biking was Ballona Creek Bike Path at 2,360 bicyclists. The second highest recorded location was Hoover St between 29th St and 30th St at 991, and Washington Blvd at 816.
8,230 people were observed biking during the weekday period. When looking at weekdays alone, Hoover St between 29th St and 30th St ranked as the top location for biking with 895 bicyclists. The second highest location, Washington Blvd, had 481 bicyclists. Figueroa St be-tween 30th St and 31st St, where a protected bike lane was recently installed in 2018, ranked as the third highest at 422. The locations with the lowest number of bicyclists were Normandie Ave at 9, Avenue 50 at 17, and Imperial Hwy at 18.
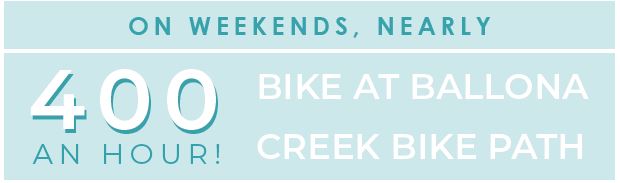
5,218 people were observed during the weekend period. The Ballona Creek Bike Path, which had a six-hour weekend count, saw 2,360 riders, or nearly 400 riders an hour. Washington Blvd observed 335 riders, and Victory Blvd ranked in third at 244 riders (across six-hours). The locations with the lowest number of bicyclists were Normandie Ave at four riders, 1st St between Soto St and Mathews St at five, and Cypress Ave at seven. The top locations for biking are:
• Bike Paths: Ballona Creek Bike Path (2,360 riders)
• Protected Bike Lanes: Figueroa St between 30th St and 31st St (554 riders)
• Buffered Bike Lanes: Chandler Blvd (208 riders)
• Standard Bike Lanes: Hoover St. between 29th St and 30th St (991 riders)
• Sharrow Lane: 1st St between San Pedro St and Central Ave (185 riders)
• Bike Routes: Figueroa St between Avenue 44 and Avenue 45 (102 riders)
• No Facility: Jefferson Blvd (355 riders)
MOTORIZED SCOOTERS
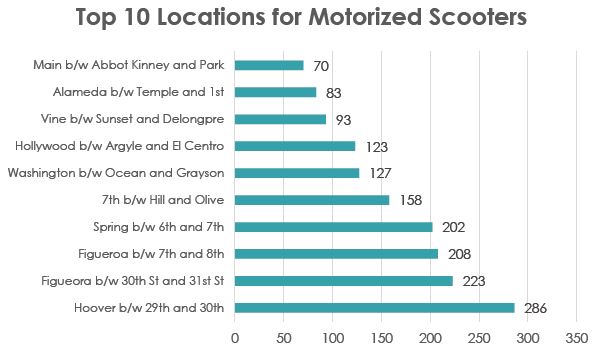
Shared motorized scooters are not permitted across the entire city. De-spite this, we recorded the number of motorized scooters we saw at all count locations. The 2019 Walk & Bike Count captured 2,342 people using motorized scooters. The top location was Hoover St between 29th St and 30th St at 286 riders, followed by Figueroa St between 30th St and 31st St at 223 riders. Not surprisingly, this reflects the high usage of scooters by students at USC traveling to and from campus, home, and their other destinations. Eight locations did not capture any motorized scooters, likely being out of permitted areas, and another 23 locations recorded less than 10 riders.
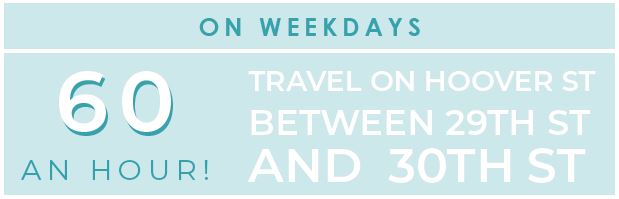
1,696 people were observed riding scooters in our weekday six-hour counts. Similar to overall trends, the top location for riding on week-days was Hoover St between 29th St and 30th St at 205 riders, Figueroa St between 30th St and 31st St at 188, and Spring St at 151. Nine locations did not report any riders.
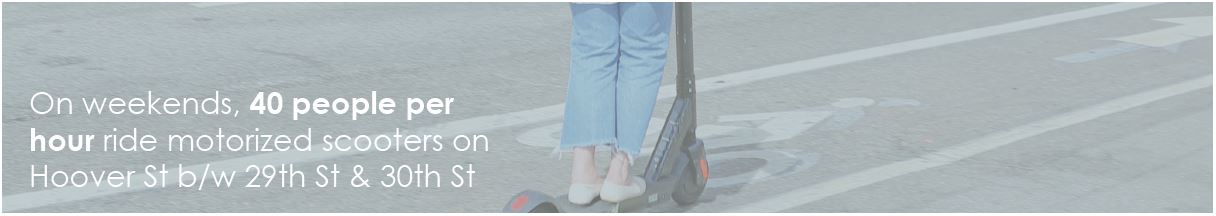
646 people were observed riding scooters in the weekend period. On weekends, Hoover St between 29th and 30th again ranked the highest at 81 riders, followed by 7th St at 66, and Figueroa St between 7th St and 8th St at 64. 20 of our locations reported no riders, and another 24 locations reported less than 10 riders. The top locations for riding motorized scooters by each bike facility type is listed below.
• Bike Paths: Ballona Creek Bike Path (49 riders)
• Protected Bike Lanes: Figueroa St between 30th St and 31st St (223 riders)
• Buffered Bike Lanes: Chandler Blvd (44 riders)
• Standard Bike Lanes: Hoover St between 29th St and 30th St (286 rid-ers)
• Sharrow Lane: Vine St (93 riders)
• Bike Routes: Broadway (6 riders)
• No Facility: Hollywood Blvd (123 riders)
OTHER RIDERS
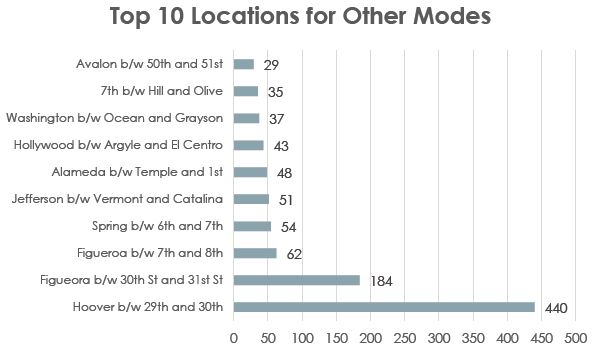
1,510 people used other active modes of travel in this year’s count. This mostly consisted of people skateboarding, but we also observed peo-ple using roller skates, hoverboards, and more. The top location for other modes was Hoover St between 29th St and 30th St at 440 people, fol-lowed by Figueroa St between 30th St and 31st St at 184, and Figueroa St between 7th St and 8st St at 62. Four locations did not observe any people, and another 26 locations observed less than 10 people using other modes.
1,201 people were observed in our weekday six-hour counts. Hoover St between 29th St and 30th St ranked the highest at 378 people, a total of over 60 people an hour. Following was Figueroa St between 30th St and 31st St at 170 riders, and both Spring St and Jefferson Blvd at 42.
309 people were observed in our weekend counts. Similarly, Hoover St between 29th St and 30th St ranked the highest at 62 riders, fol-lowed by Figueroa St between 7th St and 8th St at 21, and Victory Blvd at 15. Seven locations did not observe anyone using other modes of travel, and 45 locations captured less than 10 riders.
The results show that skateboarding, among other modes, is a popular choice for USC students!
SIDEWALK RIDING
Our count captured positioning for those riding bikes, scooters, and using other active travel modes. Each traveler was recorded as using the roadway or sidewalk. The roadway is defined as either the bike lane, or the vehicle lane if there is no dedicated bike lane. The propensity of sidewalk riding on a given street is an indicator that a street may not feel comfortable or safe for riders. In the City of Los Angeles, riding on the sidewalk is legal for bicyclists, skateboarders, and roller skaters as long as you are being safe to others around you. In California, riding motorized scooters on the sidewalk is against the law, and scooter users are required to use the roadway.
Across all modes, 26% of people ride on the sidewalk. This de-creased to 22% for bicyclists, and increased to 28% for motorized scooters. These findings are generally consistent across both weekday and weekend periods.
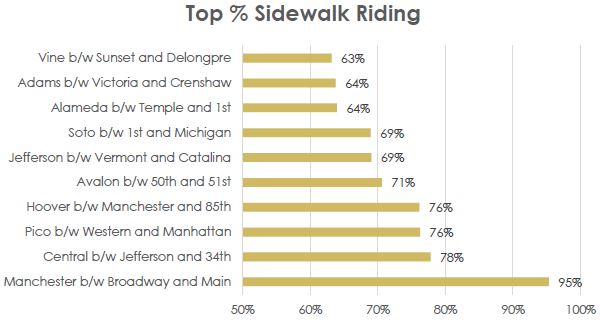
For bicyclists, the location with the highest proportion of sidewalk riding was Manchester Ave at 96%, followed by Central Ave between 34th St and Jefferson Blvd (78%), and Pico Blvd (77%). The streets with the lowest proportions of sidewalk riding were Griffith Park Blvd at no riders, and both Exposition Blvd and Main St between Thornton Pl. and Park Ave at 1% of riders. All three of these locations have a bike lane coupled with a narrow sidewalk that may discourage sidewalk riding.
For people riding motorized scooters, the smaller sample sizes at each location resulted in higher percentages of sidewalk riding. Locations that recorded 100% sidewalk riding had only one user. Excluding these locations, Adams Blvd had the highest percentage of sidewalk riding for scooters at 91% (11 samples). At the seven locations with over 100 scooter riders captured, the average sidewalk riding was 21%. Six of these seven locations had a dedicated bike lane.
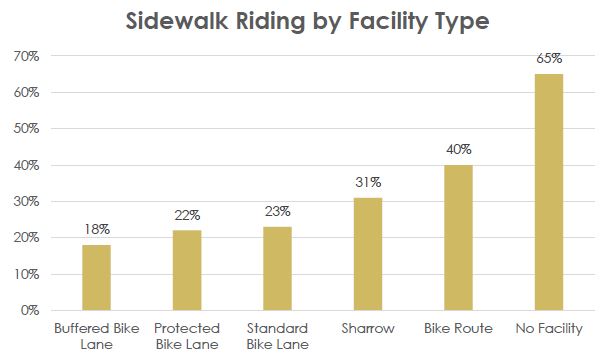
Not surprisingly, 10 of the 15 locations with the highest percentages of sidewalk riding had no bicycle facility. When observing this data by bicycle facility types, buffered bike lanes had the lowest percentage of sidewalk riding (18%), followed by protected bike lanes (22%), standard bike lanes (23%), sharrows (31%), routes (40%), and no facilities (65%).
HELMET USE
California law does not require adults 18 and over to wear a helmet, and as of January 1, 2019, a person can also ride motorized scooters without a helmet. Despite this, officials still recommend wearing a helmet when using bicycles and motorized scooters.
4,484 people used helmets in the 2019 Walk & Bike Count. On average 33% of bicyclists wore helmets when riding, and 8% of people riding motorized scooters wore helmets. On weekends, helmet usage increased to 40% for bicyclists, as more people ride for recreation purposes or for sport.
For biking, 15 locations recorded half or more of riders using helmets. The highest rates of helmet usage was Colorado Blvd (78%), Griffith Park Blvd (68%), and Silver Lake Blvd (66%). All 15 of these locations had a bike facility. Helmet usage decreased to around 14% at locations with-out bike facilities, and increased to 52% at bike paths.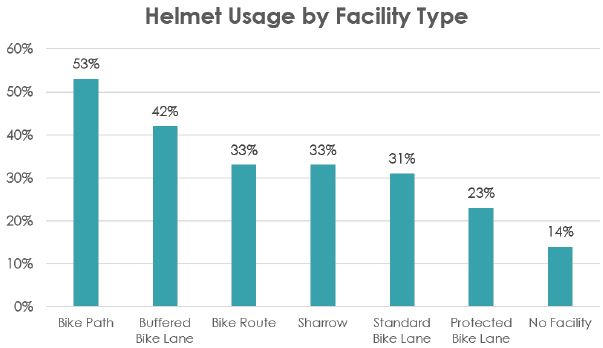
BIKESHARE RIDERSHIP
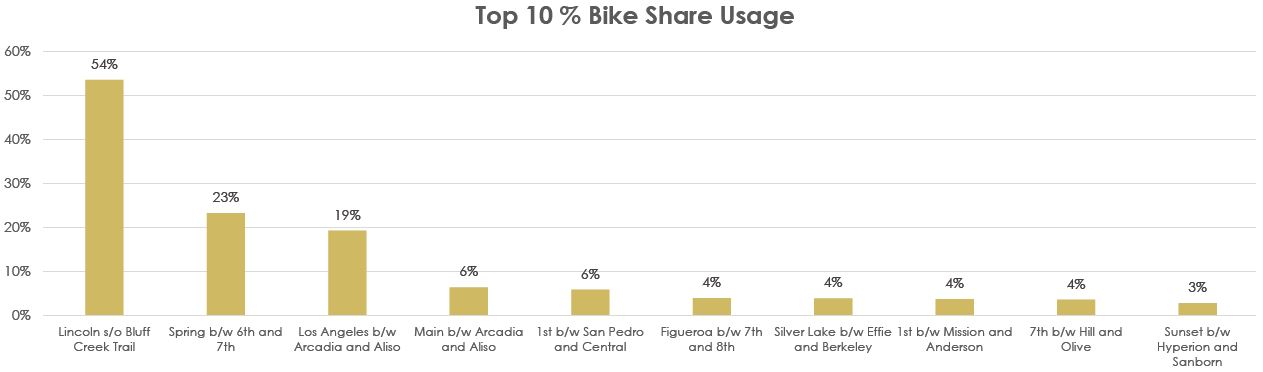
We captured bike share usage at 50 of the 63 locations, noting if a bicyclist was using the Metro Bike Share system or any other dockless bike share systems. Although they do not cover the entire city, collecting this data helps us observe the geographic demand and reach of the existing systems.
We observed 219 bike share users during the 2019 Walk & Bike Count, accounting for 2% of all bicyclists. This increased to 3% during the week and decreased to nearly 1% on the weekend. During the week, Lincoln Blvd south of Bluff Creek Dr had the highest proportion of bike share users at 54%, followed by Spring St (23%), and Los Angeles St (19%). During the weekend, Figueroa St between 7th St and 8th St, Rowena Ave, and Fletcher Dr all ranked the highest at 10% bike share usage.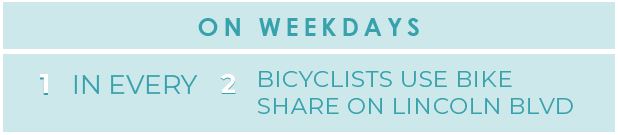
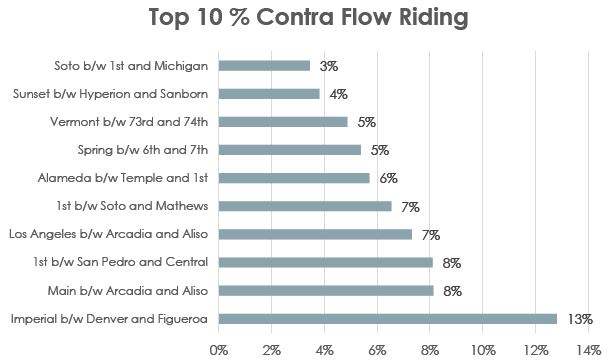
CONTRA FLOW RIDING
Contra flow riding is defined as those riding in the opposite direction of the flow of traffic, such as riding eastbound in a westbound bike lane or vehicle lane. This information was captured for those riding bicycles, motorized scooters, and using other modes of travel in the bike lane or vehicle lane. Contra flow riding was not recorded on sidewalks as there is no designated direction of travel. People more often ride contra flow on one-way streets or when their destinations are on a side of street opposite of the direction of travel.
Only 22 of the 63 locations collected data on contra flow travel. The average rate of contra flow riding was 2% for bicyclists in the 2019 Walk & Bike Count. This rate increased to 10% for motorized scooters. For bicyclists, the highest rate of contra flow riding was 23% at Alameda St. For motorized scooter riders, the highest rate was 12% at Los Angeles St.
GENDER
Why did we capture people’s gender in the Walk & Bike Count? Gender parity is considered an important indicator of success in creating safe, comfortable and attractive conditions for people traveling. For women in particular, their mobility needs and preferences have historically been unaccounted for as transportation systems are planned, in part because they haven’t been measured. For the count, we asked observers to classify each traveler by their perceived gender. We recognized that perceived gender is an imperfect metric and may not align with the self-identified gender of the traveler.
Of the 87,667 total people we observed in our count, 37% were perceived to be female. This increased to 40% for those walking, and decreased to 18% for motorized scooter riders, 17% for bicyclists, and 9% for people using other modes of travel.
For people walking, only four of the 63 locations recorded more females than males. The top proportion of female walkers was at Rowe-na Ave and Silver Lake Blvd (53%), followed by Cypress Ave (52%), and Colorado Blvd (51%). The lowest proportion of female walkers was at Central Ave between 103rd St and 105th St at (6%), the Los Angeles River Bike Path (11%), and Pacific Ave (18%).
When looking at weekend walking travel alone, the proportion of females increased to 44%, with eight locations recording more fe-males than males. This higher proportion of female travelers during the weekend mid-day period has been found in other studies. In the Metro “Understanding How Women Travel” report released in 2019, female respondents were more likely to say they travel during weekend mid-day hours.
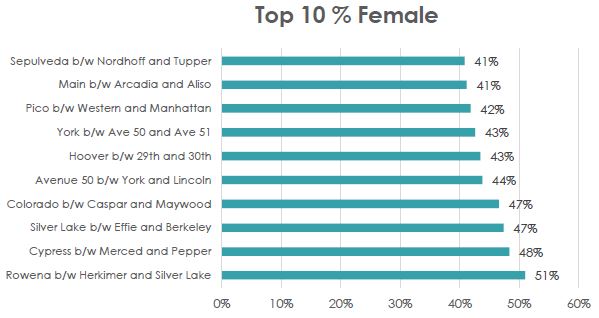
On weekdays 15% of bicyclists were female and this increased to 17% on weekends. Overall, the highest proportion of females was on Hoover St between 29th St and 30th St (37%), followed by the Los Angeles River Bike Path (34%), and Reseda Blvd (26%). The lowest percentage of female bicyclists were at Soto St and Sepulveda Blvd with no riders, and Pacific Ave at 2% of riders. On weekends, the highest percentages of female bicyclists were at Hollywood Blvd (60%), Reseda Blvd (35%), and the Los Angeles River Bike Path (34%).
For motorized scooter riders, the smaller sizes resulted in some locations reporting high percentages of female riders. Avenue 50, Fletcher Dr, and Griffith Park Blvd all reported 50% female riders, but only had less than five samples. Main St between Thornton Pl and Park Ave had 49% female scooter users with a significantly larger sample size (70 riders). On weekdays females made up 17% of total riders, though this increased to 21% on weekends. 26 locations did not have any female riders.
The smaller sample sizes for people using other modes also resulted in some locations with a high percentage of female travelers. The lo-cations that ranked the highest were Western Ave (100%), Fountain Ave (50%) and the Orange Line Bike Path (40%), though all only had less than six users. On weekdays females made up 8% of total users, though this increased to 21% on weekends. 36 locations did not report any female users throughout both the weekday and weekend periods.
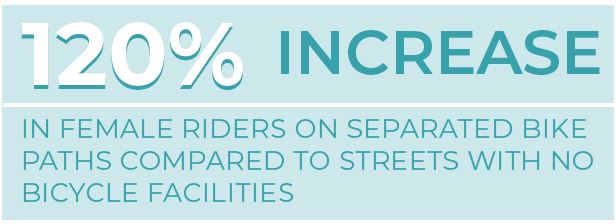
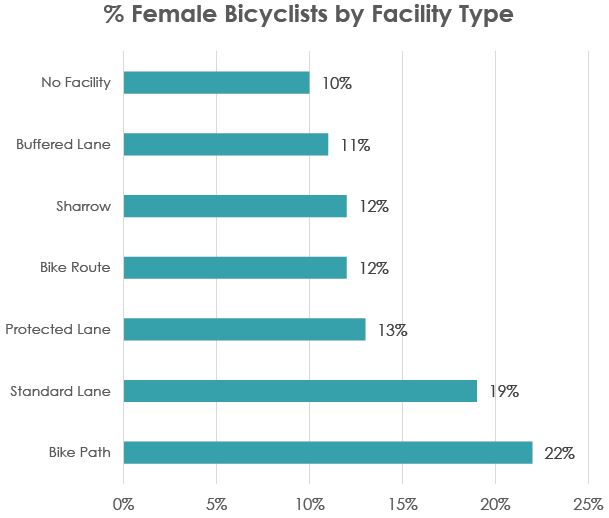
Not surprisingly, female bicyclists generally tend to prefer streets with bicycle facilities. Though the citywide average percentage of fe-male bicyclists is 17%, this increases to 19% on bike lanes, and 22% on separated bike paths. Our count locations without any type of bicycle facility only reported 10% of riders being female.

This section summarizes how the data from our 2019 Walk & Bike Count compared to previous reporting years in the Bike + Ped Count. This section will also summarize data from the U.S. Census American Community Survey from 2009 to the most recent year 2018.
LIMITATIONS
There are a few limitations to directly comparing the results to the Bike + Ped Count. Only 23 locations in the Walk & Bike Count were captured at exactly the same block. 21 locations are located near but not exactly on the same (between one block and one mile away). These counts were relocated often to better align with Vision Zero priority corridors or other criteria. For this report, relocated counts will be compared to their former location.
In addition, the Bike + Ped Count collected weekday travel from 7-9 AM and 4-6 PM, a total of four hours, compared to the Walk & Bike Count which captures 7-10 AM and 3-6 PM (six hours). To keep consistent with previous counts, all longitudinal analysis only includes the same four hours of data during the week.
Some of the previous years had one or more hours of data incomplete at some locations. To account for this, only the time periods that matched across the years were used for comparison. For example, if only a PM and weekend count was recorded in 2017, only the PM and weekend count in 2019 was used for comparison.
Data from the years 2009 and 2011 will not be used in this comparison due to a differing counting methodology used during those years. In the 2009 and 2011 Bike + Ped count, intersection counts were performed by counting all those people using the crosswalks at an intersection.
TRENDS IN VOLUMES
39 of our count locations had 2017 data during one or more matching time periods, while 40 had 2015 data recorded, and 27 locations had 2013 data recorded.
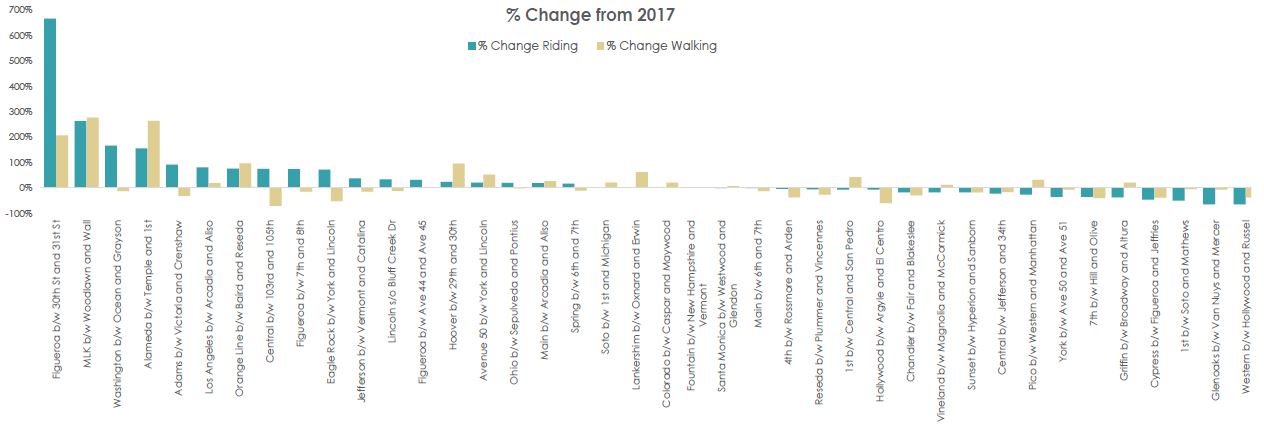
When comparing the matching locations and time periods in 2017 to their 2019 counts, the total travelers decreased from 40,636 to 39,562, a 3% decrease. The data also shows a 3% decrease to their 2015 counts, but has increased 66% since 2013. 19 of the 39 locations, almost 50%, saw an increase in total travelers, with the largest change at Martin Luther King Jr Blvd which saw a 275% increase in travel. Following that is Figueroa St between 30th St and 31st St (261%), and Alameda St (246%). It is worth noting that both Martin Luther King Jr Blvd and Alameda St were relocated one block away from their former count locations, and Figueroa St was relocated 0.9 miles away to better capture the MyFigueroa streetscape project.
For people walking and using other’ modes of travel, the number have decreased from 36,484 to 34,444, or 6%. 17 of the 39 locations saw an increase in walking, and the largest change in walking was found at Martin Luther King Jr Blvd at 277%, followed by Alameda St (264%), and Figueroa St between 30th St and 31st St (206%). The Orange Line Bike Path, Hoover St between 29th St and 30th St, Lankershim Blvd, and Avenue 50 also saw increases of over 50%.
For all people riding bicyclists and motorized scooters, riding increased from 4,184 to 5,118, a 22% increase since 2017. Riding has also increased 4% since 2015, and 49% since 2013. 21 of the 39 locations, or 54% of locations, saw an increase in riding. The largest increase was at Figueroa St between 30th St and 31st St (665%), followed by Martin Luther King Jr Blvd (263%), and Washington Blvd (166%). Seven other locations saw increases of over 50%: Alameda St, Adams Blvd, Los Angeles St, Central Ave between 103rd St and 105th St, Figueroa St between 7th St and 8th St, Eagle Rock Blvd, and the Orange Line Bike Path.
TRENDS IN CHARACTERISTICS
How do traveler characteristics in 2019 compare to previous years? This section uses data from 2017, 2015, 2013, 2011, and 2009 for comparison. Due to limited data on people walking in these years, this analysis will focus on comparing the characteristics of those biking.
HELMET USE
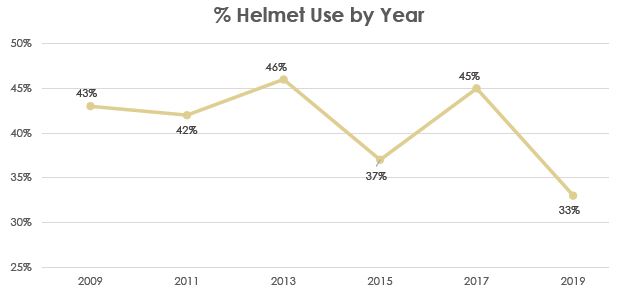
Though helmet has fluctuated each year, it has dropped below historic levels. The percentage of helmet users decreased 12% between 2017 and 2019. While we observed 33% of bicyclists use a helmet in 2019, this number was 45% in 2017, 37% in 2015, 46% in 2013, 42% in 2011, and 43% in 2009. This percentage has fluctuated over the years, but remains below half of all bicyclists. We hope to see this percentage return to nearly one in every two riders.
SIDEWALK RIDING
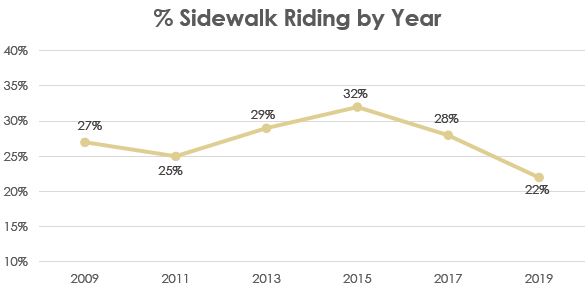
Sidewalk riding is the lowest it has been in the past decade! This indicates the benefits we have seen from our continued expansion of protected and buffered bicycle facilities. 22% of bicyclists were recorded as riding on the sidewalk in 2019. This percentage has decreased from the 28% recorded in 2017. This is also a decrease from 32% recorded in 2015, 29% in 2013, 25% in 2011, and 27% in 2009.
CONTRA FLOW RIDING
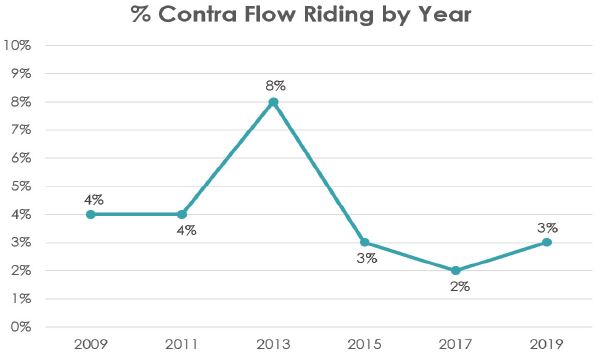
The proportion of contra flow riding has shown moderate variations across each year but remains below 10% of total riders. Contra flow riding accounted for 3% of total riding in 2019, a small increase from 2% of riders in 2017. This percentage was 3% in 2015, 8% in 2013, and 4% in 2011 and 2009.

GENDER
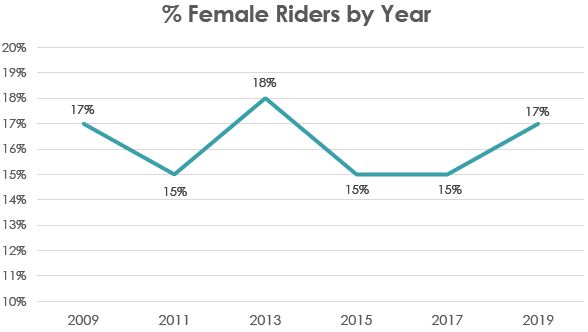
The proportion of female bicyclists in the 2019 count (17%) has shown a modest increase from the previous two counts. In the 2017 Bike + Ped Count, 15% of bicyclists were female, followed by 15% in 2015, 18% in 2013, 15% in 2011, and 17% in 2009. Though we have seen more female riders in 2019, we hope to grow this number to over 20%, or one in every five riders.
Female ridership remains higher on separated bike paths and lower on streets without any bicycle facility. While 22% of riders on bike paths were female in 2019, this was similarly reported as 23% in 2017, and while 10% of riders were female at locations with no bicycle facility in 2019, this percentage was 11% in 2017.

Fall 2018 marked the completion of a major streetscape project in the heart of downtown Los Angeles. The MyFigueroa project, extending from 7th St in down-town to Martin Luther King Jr Blvd in Exposition Park, included dedicated bus only lanes, protected and buffered bicycle lanes, and sidewalk improvements. Two locations in the Walk & Bike Count are on the MyFigueroa project corridor: Figueroa St between 7th St and 8th St, and Figueroa St between 30th St and 31st St. These counts allow us to assess changes in travel and behavior by comparing to the previous recorded counts in the Bike + Ped Count.
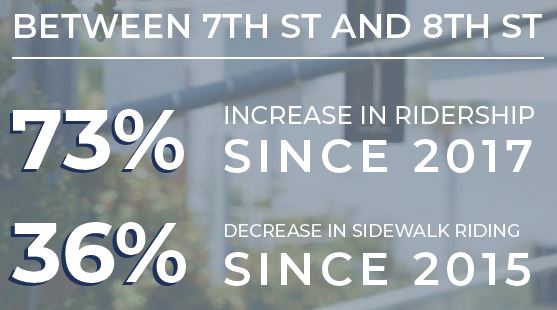
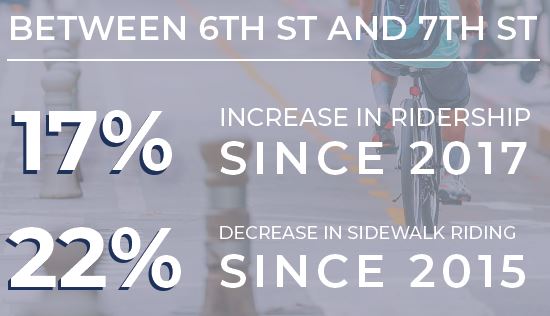
Ridership at between 7th St and 8th St has increased 73% since 2017, from 230 to 399 riders in the six-hour period. The count location between 30th St and 31st St recorded 421 riders in 2019, a 665% increase from the previous count per-formed nearby in 2017.
Walking in the downtown area of MyFigueroa shows a 15% decrease from its 2017 count, from 9,052 to 7,674 people walking. Despite this, walking continues to increase closer to USC, and the 2019 count recorded a 206% increase from volumes captured nearby in 2017.
Though we don’t have 2017 data on traveler characteristics for Figueroa St, we have seen positive trends compared to 2015 and 2013 counts at these locations. The percentage of female riders between 7th St and 8th St has increased 4% from 2015, and between 30th St and 31st St it has increased 6%. More people are also using helmets when riding. Helmet use increased 9% since 2015 between 7th St and 8th St and 2% between 30th St and 31st St.
One of the biggest indicators for perceived safety is the substantial decrease in sidewalk riding. Since 2015, sidewalk riding has decreased 36% between 7th St and 8th St, and decreased 60% between 30th St and 31st St. Those that are riding on the sidewalk between 7th St and 8th St were mostly found traveling opposite of the flow of traffic on the one-way street.

Also in fall 2018, LADOT improved bike lanes on Spring St in downtown Los Angeles to be parking protected between 3rd St and 9th St. This project was later upgraded to accommodate contra flow travel, making it LA’s first contra flow bike lane. Spring St between 6th St and 7th St had been captured in the Bike + Ped Count since 2015 and was continued in 2019.
Since the improvements on Spring St, ridership has increased 17% since 2017, from 335 to 393 riders. Most significant is the increase in people riding on weekends, up 43% since 2017. Ridership has also increased 58% since 2015, indicating a steady incline in the last five years. Despite these increases, we saw less people walking on Spring St, a 11% decline from 2017.
We are also seeing other positive changes on Spring St. Female ridership on Spring St has increased 2% since 2015, and the percentage of riders that use the sidewalk has decreased by a substantial amount (22%), as more people feel comfortable using the protected bike lane.
U.S. AMERICAN COMMUNITY SURVEY
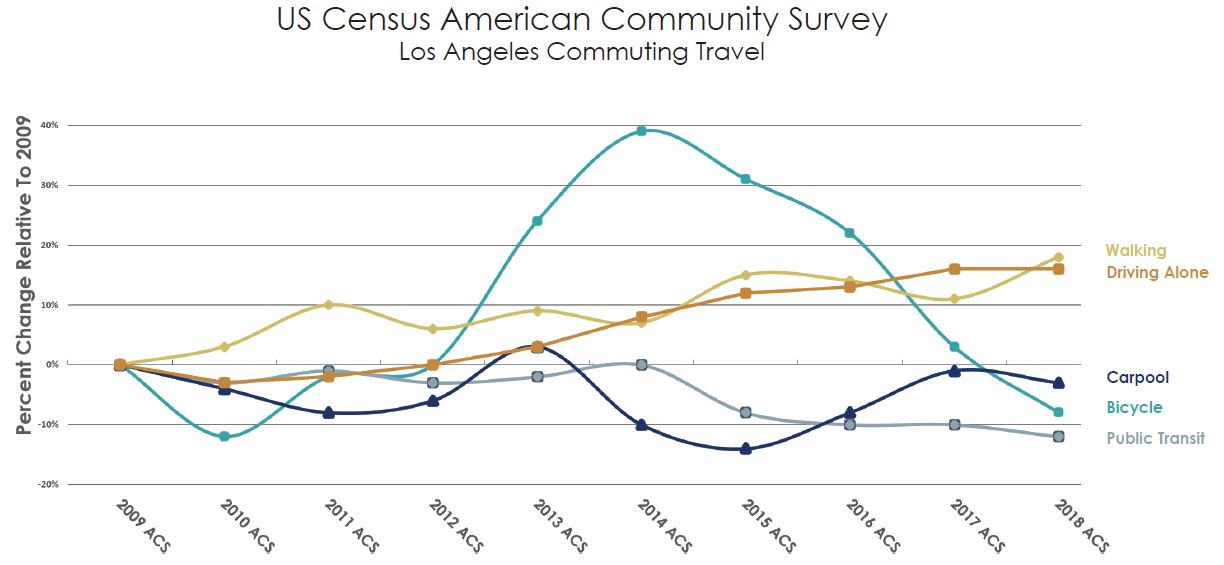
This section summarizes the one-year estimates of commuting travel taken from the U.S. ACS survey from 2009 to 2018. 2019 data is not available at the time of this report.
According to the U.S. ACS one-year estimates, there were 70,150 people who primarily walked to work in Los Angeles in 2018. This marks a 6% increase from the year prior, where 65,746 people reported as walking to work. The average annual growth rate of commuter walking since 2009 is 2%, and walking to work is the highest it has been in the last decade. This average annual growth rate was 5% for males walking to work, and 1% for females. Comparing 2018 data to just a decade ago,walking to work increased by over 18%, with a 6% increase in increase for males surveyed and a 21% growth in daily walking for females.
The ACS one-year estimates reported 16,034 people that biked to work in 2018, a 11% decrease from the year prior. This annual decline in bicycle commuting is found as far back as 2014. Commuting by public transit has also seen a steady decline since 2014, while the number of people driving alone has increased. This is part of a larger trend that is believed to be partly attributed to the recovery of the economy after the 2008 financial crisis.

The 2019 Walk & Bike Count Report provides a snapshot of all the ways people are actively traveling in Los Angeles. The additional traveler attribute data we collect will allow us to continually gauge perceptions of safety, comfort, and access, allowing us to find ways we can make our streets safer and more enjoyable for travel.
Four years of longitudinal count data suggest that biking demand continues to increase in Los Angeles, and that as bicycle facilities are constructed and further improved, ridership will grow. Results from the U.S. American Community Survey indicate bike riding as a method of commuting had declined, suggesting that more people may be biking for recreation, or to get to their local destinations. On the other hand, walking has declined as observed by our longitudinal analysis, though walking to work has increased.
Figueroa St and Spring St provide specific evidence to the benefits that protected bicycle facilities have on bicycle ridership and user behavior. We will continue to monitor travel patterns at locations that have already received these safety investments, while also measuring those locations that receive investments throughout 2019 and 2020. This will include the expansion of protected bike lanes in downtown and south LA. While in many cases obvious relationships exist between walking and biking volumes and facility investments, the outcomes of projects are also dependent on the development of neighboring facilities which provide safer and more accessible connections.
We continue to see the relationships between dense commercial areas and more walking, with locations such as Figueroa St in downtown LA recording 1,300 people an hour. With other modes of travel, such as motorized scooters and skateboarders, the most utilized areas in the city align with learning institutions. Bike paths report the highest bicycle volumes among other facilities and are also enjoyed by other active modes of travel.
Traveler characteristic data indicates some positive trends and also areas for improvement. Female bicycle ridership is growing, but remains below 20% of all bicyclists. Less people are riding on the sidewalk than in previous years, but one in every five bicyclists rides on the sidewalk even on protected bicycle facilities. We expect these behaviors to adjust as more people be-come more familiar with newer design treatments. Helmet usage is lower than historic records, and is even lower at locations without bicycle facilities where they may be needed the most. Overall, the Walk & Bike Count finds that bike facility investments means more bicyclists will be observed, a greater proportion of them will be women, and less people will ride on sidewalks.
2019 marked a decade of regularized count data collected in the City of Los Angeles. This effort was spearheaded by community activists and organizations that strongly felt this data to be necessary for measure, prioritize, and better leverage additional investments. We will continue to build off the LA Bike + Ped Count, and will work with our community partners who can help inform our methodology and count placements.
We hope to expand our Walk & Bike Count, which will allow us to measure travel across more neighborhoods, land use types, and facilities. You can provide your feedback on where you would like to see us count by emailing ladot.trafficsurveys@lacity.org. The data from this report will be available to view and download at the the City of Los Angeles Open Data Portal, on the SCAG Active Transportation Database, and also on NavigateLA.
Thank you for all our volunteers and community partners who made this count a success.